This is an old revision of the document!
Table of Contents
Profiling CP2K
Why profiling ?
In order to understand and improve the run-time performance of CP2K it is often needed to collect detailed timing information. This provides answers to questions such as 'how long does this subroutine take?' or 'who calls this subroutine'. This is most useful for developers, (non-expert) users rarely ever need this detailed info.
Probably the most important part of a profiling exercise is taken a reasonable test case. Does it run quickly enough to be practical, long enough to be accurate ? Most importantly, does it exercise the interesting or relevant parts of the code. By selecting a suitable input, profiling can become much more precise, interesting, …
The basics
Total runtime can easily be obtained
time ./cp2k.sopt -i C.inp -o C.out
real    0m6.689s
user    0m6.486s
sys     0m0.186s
This matches, apart from small program start-up overhead, the time that is measured by CP2K.
grep -e "STARTED AT" -e "ENDED AT" -e " CP2K      " C.out
  **** **** ******  **  PROGRAM STARTED AT               2013-07-01 19:59:53.408
 CP2K                                 1  1.0    0.007    0.007    6.590    6.590
  **** **** ******  **  PROGRAM ENDED AT                 2013-07-01 20:00:00.060
The middle line matching “CP2K ” comes from the timing report, explained in the next section. In this case, the most relevant time is the last number in the line, i.e. total runtime in seconds.
CP2K timing output
understanding the CP2K timing output
A more detailed view is obtained by looking at the timing report in the output file
 -------------------------------------------------------------------------------
 -                                                                             -
 -                                T I M I N G                                  -
 -                                                                             -
 -------------------------------------------------------------------------------
 SUBROUTINE                       CALLS  ASD         SELF TIME        TOTAL TIME
                                              AVERAGE  MAXIMUM  AVERAGE  MAXIMUM
 CP2K                                 1  1.0    0.007    0.007    6.590    6.590
 qs_forces                            1  2.0    0.000    0.000    6.073    6.073
 qs_energies_scf                      1  3.0    0.000    0.000    5.586    5.586
 scf_env_do_scf_inner_loop            8  5.0    0.004    0.004    5.232    5.232
 scf_env_do_scf                       1  4.0    0.000    0.000    5.232    5.232
 qs_ks_build_kohn_sham_matrix         9  6.7    0.006    0.006    4.440    4.440
 qs_ks_update_qs_env                  8  6.0    0.000    0.000    3.954    3.954
 fft_wrap_pw1pw2                     28  9.0    0.000    0.000    3.634    3.634
 fft3d_s                             29 10.7    2.326    2.326    2.329    2.329
 sum_up_and_integrate                 9  7.7    0.112    0.112    1.460    1.460
 calculate_rho_elec                   9  7.0    0.161    0.161    1.416    1.416
 qs_rho_update_rho                    9  6.0    0.000    0.000    1.416    1.416
 integrate_v_rspace                   9  8.7    0.071    0.071    1.348    1.348
 potential_pw2rs                      9  9.7    0.000    0.000    1.276    1.276
 density_rs2pw                        9  8.0    0.000    0.000    1.241    1.241
 xc_vxc_pw_create                     9  8.7    0.094    0.094    0.881    0.881
 [...]
 -------------------------------------------------------------------------------
The columns are :
- SUBROUTINE: name, usually easily found in the CP2K code by 'grep qs_ks_build_kohn_sham_matrix' or similar. Sometimes a suffix is used to time sub-parts of a subroutine or to provide details.
- CALLS: the number of calls to this timer
- ASD: The 'Average Stack Depth', i.e. the average number of entries on the call stack. In the example above, it can be used to guess that qs_energies_scf is called by qs_forces is called by CP2K. However, see also the CALLGRAPH section below.
- SELF TIME: How much time is spent in this subroutine, or in non-timed subroutines called by this subroutine. AVERAGE and MAXIMUM correspond to this quantity compared between different MPI ranks, and can be used to locate load-imbalance or synchronization points.
- TOTAL TIME: How much time is spent in this subroutine, including time spent in timed subroutines. AVERAGE and MAXIMUM as defined above
Note that, for the threaded code, only the master thread is instrumented.
Modifying the timing report
The advantage of the CP2K timer report is that it corresponds to 'hand-picked' routines in CP2K. Only those that are most relevant are included, and the profiling overhead is small because tiny, frequently called routines are not included. By modifying (and recompiling) the code and inserting
CALL timeset(routineN,handle)
! Region to be timed
CALL timestop(handle)
more results can be obtained.
The CP2K callgraph
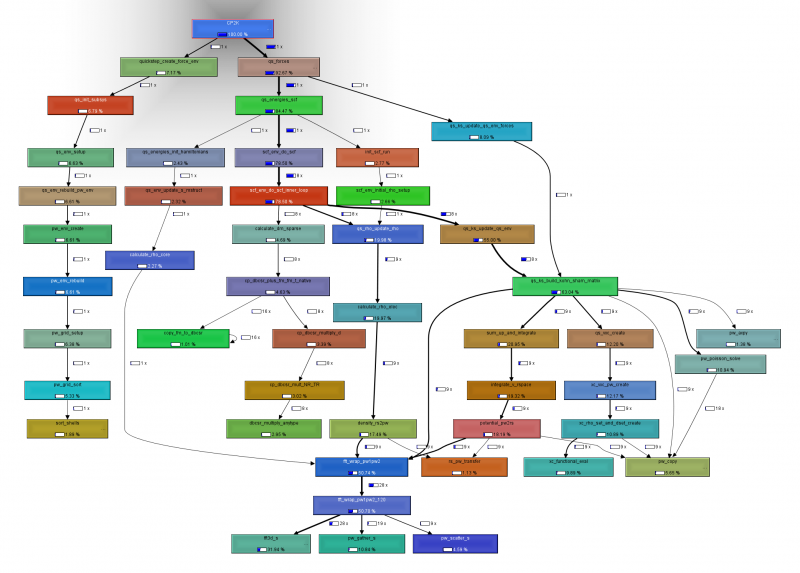
Often, it is useful to have a more detailed picture of the timing report. This can be obtained using the ' CALLGRAPH' keyword in the input file. This results in a file 'PROJECTNAME.callgraph' that can be visualized with a tool called kcachegrind (available on most distros). An intuitive user interface allows for exploring the callgraph.
The CP2K trace
The timer events are also available as a trace during execution. This can be obtained using the ' TRACE' keyword in the input file. The result is similar to:
 000000:000001>>                 7      1 fft_wrap_pw1pw2       start 282 Mb
 000000:000001>>                    8      1 fft_wrap_pw1pw2_120       start 282 Mb
 000000:000001>>                       9      2 fft3d_s       start 309 Mb
 000000:000001>>                         10      2 get_fft_scratch       start 309 Mb
 000000:000001<<                         10      2 get_fft_scratch       0.002 362 Mb
 000000:000001<<                       9      2 fft3d_s       0.086 362 Mb
 000000:000001>>                       9      1 pw_gather_s       start 362 Mb
 000000:000001<<                       9      1 pw_gather_s       0.046 362 Mb
 000000:000001<<                    8      1 fft_wrap_pw1pw2_120       0.145 335 Mb
 000000:000001<<                 7      1 fft_wrap_pw1pw2       0.145 335 Mb
where
- is an indicator of the MPI rank
- is the stack depth (properly aligned)
- is the call count
- is the subroutine name
- is either 'start' at entry of or a number at exit, which is the time in seconds of that invocation.
- is a measure of the process memory used at the time of timeset/timestop.
The trace is also a useful debugging tool in the event of crashes, as it usually ends near the offending subroutine.
As the trace tends to be very verbose, further keywords (TRACE_MAX, TRACE_ROUTINES) allow for restricting the amount of information.

