Table of Contents
Molecular orbitals of Ethene
In this exercise, you will perform an electronic structure calculation to obtain the ethene molecular orbitals (MOs). If performed correctly, your calculations will produce a list of occupied and non occupied MOs and a series of *.cube files, that allow the visualization of the oribital with VMD.
1. Step
Run a calculation with the following (commented) input file.
Note that the file contains explicit basis sets and potential for all-electron calculations. An explanation of the basis set formats is given here: Basis Sets
- ethene.inp
&GLOBAL
  PROJECT ethene
  RUN_TYPE ENERGY
  PRINT_LEVEL MEDIUM
&END GLOBAL

&FORCE_EVAL
  METHOD Quickstep              ! Electronic structure method (DFT,...)
  &DFT
    &PRINT
      &MO_CUBES                 ! Controls the printing of the MOs in the output and in the *.cube files
      NHOMO 5                   ! Number of HOMOs to be printed (count starts from the highest occupied orbital. -1 = all). Here 5.
      NLUMO 5                   ! Number of LUMOs to be printed (count starts from the lowest unoccupied orbital). Here 5.
      &END MO_CUBES
    &END PRINT
    &POISSON                    ! Solver requested for non periodic calculations
      PERIODIC NONE
      PSOLVER  WAVELET          ! Type of solver
    &END POISSON
    &QS                         ! Parameters needed to set up the Quickstep framework
      METHOD GAPW               ! Method: gaussian and augmented plane waves
    &END QS

    &SCF                        ! Parameters controlling the convergence of the scf. This section should not be changed.
      MAX_ITER_LUMOS 10000
      EPS_SCF 1.0E-6
      SCF_GUESS ATOMIC
      MAX_SCF 60
      EPS_LUMOS  0.000001
      &OUTER_SCF
        EPS_SCF 1.0E-6
        MAX_SCF 6
      &END
    &END SCF

    &XC                        ! Parametes needed to compute the electronic exchange potential
      &XC_FUNCTIONAL NONE      ! No xc functional
      &END XC_FUNCTIONAL
      &HF                      ! Hartree Fock exchange. In this case is 100% (no fraction specified).
        &SCREENING             ! Screening of the electronic repulsion up to the given threshold.
          EPS_SCHWARZ 1.0E-10  ! Threshold specification
        &END SCREENING
      &END HF
    &END XC
  &END DFT

  &SUBSYS
    &CELL
      ABC 10 10 10
      PERIODIC NONE              ! Non periodic calculations. That's why the POISSON scetion is needed
    &END CELL
    &TOPOLOGY                    ! Section used to center the atomic coordinates in the given box. Useful for big molecules
      &CENTER_COORDINATES
      &END
    &END
    &COORD
    C         -2.15324        3.98235        0.00126
    C         -0.83403        4.16252       -0.00140
    H         -0.25355        3.95641        0.89185
    H         -0.33362        4.51626       -0.89682
    H         -2.65364        3.62861        0.89669
    H         -2.73371        4.18846       -0.89198
    &END COORD
    &KIND H                    ! Basis set and potential for H
     &BASIS
  2
  1  0  0  3  1
         18.73113700          0.03349460
          2.82539370          0.23472695
          0.64012170          0.81375733
  1  0  0  1  1
          0.16127780          1.00000000
     &END
     POTENTIAL ALL
     &POTENTIAL
     1    0    0
     0.20000000    0
     &END
    &END KIND
    &KIND C                    ! Basis set and potential for C
     &BASIS
  4
  1  0  0  6  1
       3047.52490000          0.00183470
        457.36951000          0.01403730
        103.94869000          0.06884260
         29.21015500          0.23218440
          9.28666300          0.46794130
          3.16392700          0.36231200
  1  0  1  3  1  1
          7.86827240         -0.11933240          0.06899910
          1.88128850         -0.16085420          0.31642400
          0.54424930          1.14345640          0.74430830
  1  0  1  1  1  1
          0.16871440          1.00000000          1.00000000
  1  2  2  1  1
          0.80000000          1.00000000
     &END
     POTENTIAL ALL
     &POTENTIAL
     4    2    0
     0.34883045    0
     &END
    &END KIND
  &END SUBSYS
&END FORCE_EVAL
2. Step
If the calculation was performed correctly, a list of ALL the occupied MOs and 3 (as specified in the input) unoccupied MOs eigenvalues are printed in the output.
The ethene band gap (energy difference between HOMO and LUMO) is also printed.
  **** **** ******  **  PROGRAM STARTED AT
 ***** ** ***  *** **   PROGRAM STARTED ON
 **    ****   ******    PROGRAM STARTED BY
 ***** **    ** ** **   PROGRAM PROCESS ID
  **** **  *******  **  PROGRAM STARTED IN

.....
  Eigenvalues of the occupied subspace spin            1
 ---------------------------------------------
list of eigenvalues
....

  Lowest Eigenvalues of the unoccupied subspace spin            1
 -----------------------------------------------------
list of eigenvalues
.....

 HOMO - LUMO gap [eV] :
......


  **** **** ******  **  PROGRAM ENDED AT
 ***** ** ***  *** **   PROGRAM RAN ON
 **    ****   ******    PROGRAM RAN BY
 ***** **    ** ** **   PROGRAM PROCESS ID
  **** **  *******  **  PROGRAM STOPPED IN
3. Step
In addition to the list of eigenvalues ( printed directly in the output file) a series of *.cube files is generated.
The number of cubes strictly depends on what you have specified in the PRINT_MO section. No extra files are generated (while in the output a default list of all the occupied MOs eigenvalues is anyway produced.)
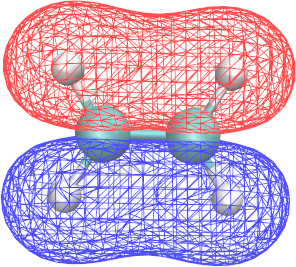
∗.cube files report the structure of a given MO and can be visualized with VMD:
- To run vmd: vmd ethene-WFN_00008_1-1_0.cube
- To visualize the molecule (sometimes the default settings are not visible with VMD in Brutus):
Graphics > Representations > Draw style > Drawing Method: CPK - To visualize the MO structure in VMD:
Graphics > Representations > Draw style > Drawing Method: Isosurfaces - In Isosurfaces, set Draw to “Wireframe” (other formats may not be visible with VMD in Brutus)
- In Isosurfaces, set Isovalue to 0.1, 0.01 …
- To visualize the positive and the negative part of an orbital simultaneously, add a second isosurface representation with isovalues -0.1, -0.01, …
- To give the two representations different colors, set their “Coloring Method” to “ColorID” and choose different ids.
Questions
- Quickly sketch the energy distribution for the occupied MOs and the five unoccupied MOs.
- By using VMD, identify the shape and energy of the π and π* orbitals.

