Table of Contents
Profiling CP2K
Why profiling ?
In order to understand and improve the run-time performance of CP2K it is often needed to collect detailed timing information. This provides answers to questions such as 'how long does this subroutine take?' or 'who calls this subroutine'. This is most useful for developers, (non-expert) users rarely ever need this detailed info.
Probably the most important part of a profiling exercise is finding a reasonable test case. Does it run quickly enough to be practical, long enough to be accurate ? Most importantly, does it exercise the interesting or relevant parts of the code. By selecting a suitable input, profiling can become much more precise, interesting, …
The basics
Total runtime can easily be obtained
time ./cp2k.sopt -i C.inp -o C.out
real    0m6.689s
user    0m6.486s
sys     0m0.186s
This matches, apart from small program start-up overhead, the time that is measured by CP2K.
grep -e "STARTED AT" -e "ENDED AT" -e " CP2K      " C.out
  **** **** ******  **  PROGRAM STARTED AT               2013-07-01 19:59:53.408
 CP2K                                 1  1.0    0.007    0.007    6.590    6.590
  **** **** ******  **  PROGRAM ENDED AT                 2013-07-01 20:00:00.060
The middle line matching “CP2K ” comes from the timing report, explained in the next section. In this case, the most relevant time is the last number in the line, i.e. total runtime in seconds.
CP2K timing output
understanding the CP2K timing output
A more detailed view is obtained by looking at the timing report in the output file
 -------------------------------------------------------------------------------
 -                                                                             -
 -                                T I M I N G                                  -
 -                                                                             -
 -------------------------------------------------------------------------------
 SUBROUTINE                       CALLS  ASD         SELF TIME        TOTAL TIME
                                              AVERAGE  MAXIMUM  AVERAGE  MAXIMUM
 CP2K                                 1  1.0    0.007    0.007    6.590    6.590
 qs_forces                            1  2.0    0.000    0.000    6.073    6.073
 qs_energies_scf                      1  3.0    0.000    0.000    5.586    5.586
 scf_env_do_scf_inner_loop            8  5.0    0.004    0.004    5.232    5.232
 scf_env_do_scf                       1  4.0    0.000    0.000    5.232    5.232
 qs_ks_build_kohn_sham_matrix         9  6.7    0.006    0.006    4.440    4.440
 qs_ks_update_qs_env                  8  6.0    0.000    0.000    3.954    3.954
 fft_wrap_pw1pw2                     28  9.0    0.000    0.000    3.634    3.634
 fft3d_s                             29 10.7    2.326    2.326    2.329    2.329
 sum_up_and_integrate                 9  7.7    0.112    0.112    1.460    1.460
 calculate_rho_elec                   9  7.0    0.161    0.161    1.416    1.416
 qs_rho_update_rho                    9  6.0    0.000    0.000    1.416    1.416
 integrate_v_rspace                   9  8.7    0.071    0.071    1.348    1.348
 potential_pw2rs                      9  9.7    0.000    0.000    1.276    1.276
 density_rs2pw                        9  8.0    0.000    0.000    1.241    1.241
 xc_vxc_pw_create                     9  8.7    0.094    0.094    0.881    0.881
 [...]
 -------------------------------------------------------------------------------
The columns are :
- SUBROUTINE: name, usually easily found in the CP2K code by 'grep qs_ks_build_kohn_sham_matrix' or similar. Sometimes a suffix is used to time sub-parts of a subroutine or to provide details.
- CALLS: the number of calls to this timer
- ASD: The 'Average Stack Depth', i.e. the average number of entries on the call stack. In the example above, it can be used to guess that qs_energies_scf is called by qs_forces is called by CP2K. However, see also the CALLGRAPH section below.
- SELF TIME: How much time is spent in this subroutine, or in non-timed subroutines called by this subroutine. AVERAGE and MAXIMUM correspond to this quantity compared between different MPI ranks, and can be used to locate load-imbalance or synchronization points.
- TOTAL TIME: How much time is spent in this subroutine, including time spent in timed subroutines. AVERAGE and MAXIMUM as defined above
By default, only routines contributing up to 2% of the total runtime are included in the timing report. To see smaller routines, set a smaller cut-off with the GLOBAL%TIMINGS%THRESHOLD keyword
Note that, for the threaded code, only the master thread is instrumented.
Modifying the timing report
The advantage of the CP2K timer report is that it corresponds to 'hand-picked' routines in CP2K. Only those that are most relevant are included, and the profiling overhead is small because tiny, frequently called routines are not included. By modifying (and recompiling) the code and inserting
CALL timeset(routineN,handle)
! Region to be timed
CALL timestop(handle)
more results can be obtained.
The CP2K callgraph
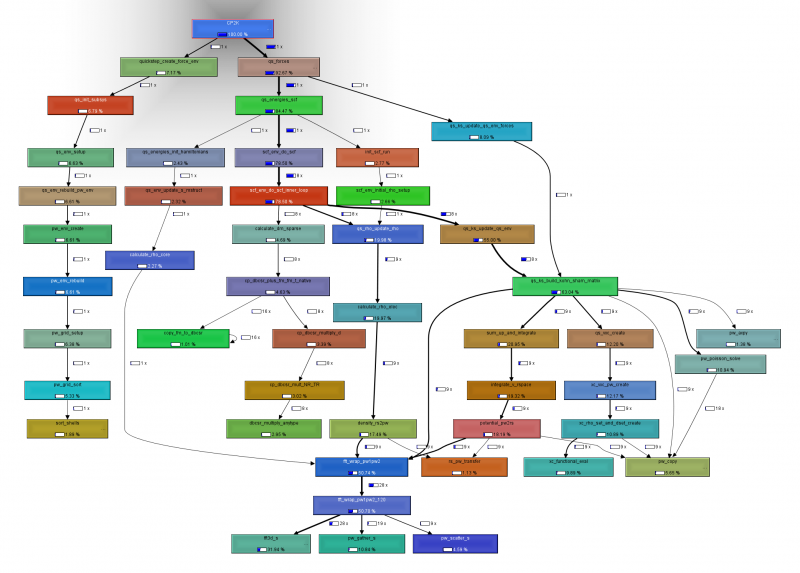
Often, it is useful to have a more detailed picture of the timing report. This can be obtained using the ' CALLGRAPH' keyword in the input file. This results in a file 'PROJECTNAME.callgraph' that can be visualized with a tool called kcachegrind (available on most distros). An intuitive user interface allows for exploring the callgraph.
The CP2K trace
The timer events are also available as a trace during execution. This can be obtained using the ' TRACE' keyword in the input file. The result is similar to:
 000000:000001>>                 7      1 fft_wrap_pw1pw2       start 282 Mb
 000000:000001>>                    8      1 fft_wrap_pw1pw2_120       start 282 Mb
 000000:000001>>                       9      2 fft3d_s       start 309 Mb
 000000:000001>>                         10      2 get_fft_scratch       start 309 Mb
 000000:000001<<                         10      2 get_fft_scratch       0.002 362 Mb
 000000:000001<<                       9      2 fft3d_s       0.086 362 Mb
 000000:000001>>                       9      1 pw_gather_s       start 362 Mb
 000000:000001<<                       9      1 pw_gather_s       0.046 362 Mb
 000000:000001<<                    8      1 fft_wrap_pw1pw2_120       0.145 335 Mb
 000000:000001<<                 7      1 fft_wrap_pw1pw2       0.145 335 Mb
where
- is an indicator of the MPI rank
- is the stack depth (properly aligned)
- is the call count
- is the subroutine name
- is either 'start' at entry of or a number at exit, which is the time in seconds of that invocation.
- is a measure of the process memory used at the time of timeset/timestop.
The trace is also a useful debugging tool in the event of crashes, as it usually ends near the offending subroutine.
As the trace tends to be very verbose, further keywords (TRACE_MAX, TRACE_ROUTINES) allow for restricting the amount of information.
Using oprofile for sampling based results
Detailed information, in particular line based, can be obtained with external tools. oprofile is particularly useful, especially from version 0.9.8 onwards. This version allows users to straightforwardly profile their executables. For full details, consult the operf man-page.
First, this tool works best with good debug info, so compile your full code using '-O2 -g -fno-omit-frame-pointer' (provided gcc/gfortran is the employed compiler).
Next, perform a profiling run, removing any old data first:
rm -fR oprofile_data/
operf --callgraph ../../../exe/cuda/cp2k.ssmp -i bb.inp -o bb.out
After execution, the data can be analyzed in various ways. Three options are particularly useful. The first two provide a general overview, listing the routines that consume most CPU time.
opreport --exclude-dependent --demangle=smart --symbols > report.symbols
opreport -cg > report.callgraph
The output of the first option is rather obvious:
CPU: Intel Sandy Bridge microarchitecture, speed 2.001e+06 MHz (estimated)
Counted CPU_CLK_UNHALTED events (Clock cycles when not halted) with a unit mask of 0x00 (No unit mask) count 90000
samples  %        symbol name
78561    10.4904  __dbcsr_data_methods_low_MOD_set_data_area_area
72344     9.6603  __dbcsr_mm_csr_MOD_dbcsr_mm_csr_multiply_low
47158     6.2971  __dbcsr_mm_cudadrv_MOD_dbcsr_mm_cudadrv_process
41821     5.5845  __dbcsr_block_access_MOD_dbcsr_remove_block
41761     5.5764  __dbcsr_block_operations_MOD_dbcsr_data_copy_aa
37830     5.0515  __dbcsr_data_methods_low_MOD_dbcsr_data_get_size
19554     2.6111  __dbcsr_message_passing_MOD_mp_alltoall_d11v._omp_fn.3
18609     2.4849  __dbcsr_mm_csr_MOD_hash_table_get
17633     2.3546  __dbcsr_block_operations_MOD_dbcsr_data_clear0
16991     2.2688  __dbcsr_mm_cannon_MOD_make_images._omp_fn.2
16982     2.2676  __dbcsr_block_access_MOD_dbcsr_put_block_d
15819     2.1123  __dbcsr_methods_MOD_dbcsr_get_data_type_obj
15678     2.0935  __dbcsr_iterator_operations_MOD_iterator_advance
15382     2.0540  __dbcsr_block_access_MOD_dbcsr_put_block_area
for the second the manual needs to be studied 
The third option delivers line based profiling results, which can pinpoint individual statements as consuming a lot of time:
opannotate --source --include-file dbcsr_mm_csr.F > operf.annotate
which results in a copy of the source code with lines annotated. However, keep in mind that the annotation is only as good as the quality of the debug info, and that compiler optimization might result in surprising timings.
[...]
   339  0.0260 :    a_row_cycle: DO a_row_l = mi, mf
    85  0.0065 :       m_size = m_sizes(a_row_l)
               :
   235  0.0180 :       a_row_eps = row_max_epss (a_row_l)
   162  0.0124 :       mapped_row_size = row_size_maps(m_size)
               :
  1728  0.1325 :       a_blk_cycle: DO a_blk = a_row_p(a_row_l)+1, a_row_p(a_row_l+1)
   397  0.0304 :          a_col_l = a_blk_info(1, a_blk)
               :          IF (debug_mod) WRITE(*,*)ithread,routineN//" A col", a_col_l,";",a_row_l
  1104  0.0846 :          k_size = k_sizes (a_col_l)
  3194  0.2448 :          mapped_k_size = k_size_maps(k_size)
               :
   125  0.0096 :          a_norm = left_norms(a_blk)
  5763  0.4418 :          b_blk_cycle: DO b_blk = b_row_p(a_col_l)+1, b_row_p(a_col_l+1)
               :             IF (dbg) THEN
               :                WRITE(*,'(1X,A,3(1X,I7),1X,A,1X,I16)')routineN//" trying B",&
               :                     a_row_l, b_blk_info(1,b_blk), a_col_l, "at", b_blk_info(2,b_blk)
               :             ENDIF
   768  0.0589 :             b_norm = right_norms(b_blk)
  8289  0.6354 :             IF (a_norm * b_norm .LT. a_row_eps) THEN
               :                CYCLE
               :             ENDIF
  3073  0.2356 :             b_col_l = b_blk_info(1,b_blk)
[...]
In principle oprofile output can be converted to kcachegrind readable files, figuring this out is a TODO.
Valgrind
In some cases, a very detailed callgraph and timing info is required, and it is better to employ the valgrind tool. Valgrind is essentially a simulator, which allows for obtaining exact counts in the callgraph, and details about cache misses, branch mispredictions etc. The disadvantage is two-fold. First, profiling takes a long time (50x slowdown under this simulator is common), and second, it is a simulated architecture which might be (slightly) different from a real CPU (in rare cases, instructions for very new CPUs are not supported. In that case, compile without '-march=native' or optimized (e.g. mkl) libraries).
Basic profiling is easy:
valgrind --tool=callgrind ./cp2k.sopt -i test.inp -o test.out
The result, a file named callgrind.out.XXX, can be visualized with kcachegrind
nvprof
Profiling the CUDA code can be done quite nicely using the nvprof tool. To do so, it is useful to enable user events which requires compiling cp2k with
-D__CUDA_PROFILING
and linking against
-lnvToolsExt
library. For the serial code things are easy just run
nvprof -o log.nvprof ./cp2k.sopt -i test.inp -o test.out
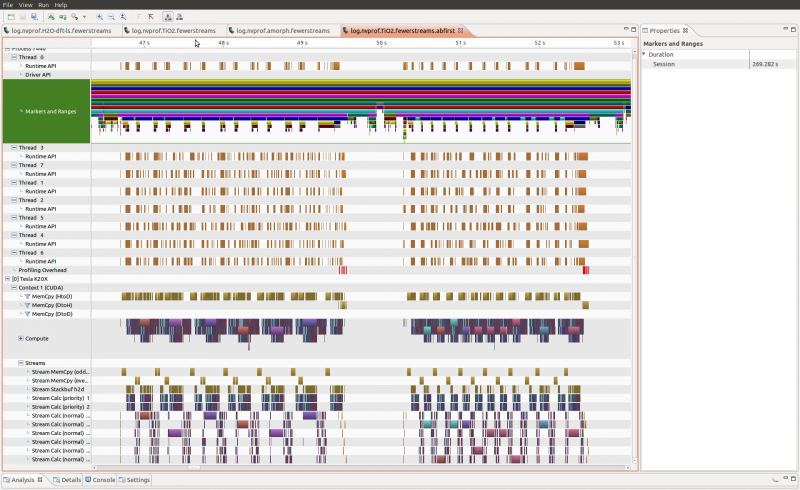
and visualize log.nvprof with the nvvp tool, which might take several minutes to open the data.
An example profile for a linear scaling benchmark (TiO2) is shown here

To run on CRAY architectures in parallel the following additional tricks are needed
export PMI_NO_FORK=1
# no cuda proxy
# export CRAY_CUDA_MPS=1
# use all cores with OMP
export OMP_NUM_THREADS=8
# use aprun in MPMD mode to have only the output from the master rank (here 169 nodes are used)
COMMAND="./cp2k.psmp -i test.inp -o test.out-profile"
PART1="-N 1  -n 1 -d ${OMP_NUM_THREADS} nvprof -o log.nvprof ${COMMAND}"
PART2="-N 1  -n 168 -d ${OMP_NUM_THREADS} ${COMMAND}"
aprun ${PART1} : ${PART2}

