This is an old revision of the document!
Table of Contents
CP2K Dashboard
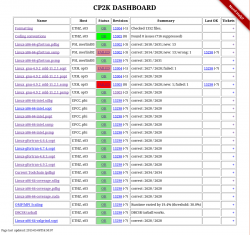
 The CP2K dashboard is hosted at http://dashboard.cp2k.org. It is the central place where we collect automatic test results.
Main View
The main view shows the latest results from all testers. The table columns have the following meaning:
| Column | Meaning | Link Target |
|---|---|---|
| Name | Display name of the tester. | archive of old reports |
| Host | Name of facility and computer which runs the test. | |
| Status | Status from latest report. See section below. | latest report |
| Revision | SVN revision from latest report, in parenthesis the backlog wrt. trunk. | SourceForge commit browser |
| Summary | Summary text from latest report. | |
| Last OK | If the status is not OK, this show the last revision that was. | Sourceforge commit browser |
| Ticket | List of open bug-tickets, which are tagged for this tester. | Sourceforge bug-tracker |
Statuses
| Status | Meaning |
|---|---|
 | The latest svn revision passed the test. |
 | The latest svn revision did not pass the test. |
 | An older svn revision passed the test. |
 | An older svn revision did not pass the test. |
 | The dashboard was unable to fetch and parse the latest report. |
 | The results are outdated, a newer revision exists for over 24 hours and has not been tested, yet. |
How does it work?
The HTML pages that make up the dashboard are generated by the script generate_dashboard.py. It is run every 5 minutes by a cron-job.
For each tester it performs the following steps:
- fetch latest report from
report_url - parse report according to its
report_type - if fetching and parsing was successful, make a copy of the report for the archive
- if the test status is FAILED and the tester has notifications enabled, send emails to responsible author(s).
Adding a Tester
To add a new tester to the dashboard, simply edit the dashboard.conf . The file has the format of the python configparser. A typical entry looks like this:
[mkrack-pdbg]
sortkey:     100
name:        Linux-x86-64-gfortran.pdbg
host:        PSI, merlinl03
notify:      off
report_type: regtest
report_url:  http://www.cp2k.org/static/regtest/trunk/Linux-x86-64-gfortran-regtest/pdbg/regtest-0
info_url:    http://www.cp2k.org/static/regtest/trunk/Linux-x86-64-gfortran-regtest/pdbg/index.html
The fields have the following meaning:
| Field | Meaning |
|---|---|
[foo_bar] | internal name of the tester, it shows up e.g. in the archive-url |
sortkey | used to order the entries in the dashboard, low means high up |
name | displayed in the first column of the dashboard |
host | displayed in the second column of the dashboard |
info_url | optional, if provided it is shows up as the “more information”-link on the archive-page |
notify | on/off switch, determines if email notifications are send upon test failure |
report_url | points to the location of the latest report |
report_type | can be either of regtest or generic |
Reports Types
Currently the dashboard supports two report types:
- A report of type
regtestis simply the output of a regtest run. - A report of type
genericis a text file that has to contain the following three lines:
Revision: <svn-revision>
...
more test output
this is ignored by the dashboard
...
Summary: <text>
Status: <OK/FAILED/UNKNOWN>
Bulk-Download of Archived Reports
Over time the dashboard archive has become quite a resource on its own. To allow for bulk-downloads of the reports two url-lists are provided:
- A full list containing all reports in the archive: http://dashboard.cp2k.org/archive/list_full.txt
- A recent list containing only reports from the last 100 commits: http://dashboard.cp2k.org/archive/list_recent.txt
You can conveniently download all reports in a list with wget:
$ wget -nH -Nxi http://dashboard.cp2k.org/archive/list_recent.txt
Added bonus: If you run the wget-command repeatedly, it'll only download the new reports.
