exercises:2018_ethz_mmm:lennard_jones_cluster_2018
This is an old revision of the document!
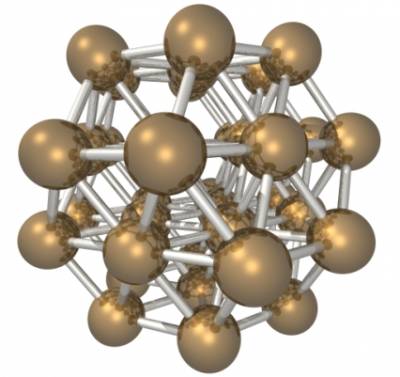
38 atom Lennard-Jones cluster
max@qmobile:~$ cp2k.ssmp -i file.inp -o file.out
Assignment:
- Report the energy of the minima, compare it with the ones of the initial configurations.
- Plot q4 vs. energy and q4 vs. optimization steps, for the two cases. Discuss the results. Are the minima in two separate basins?
- Report the value of the order parameter of the minumum, and discuss what you see
- Use “gnuplot” to make the output of “./curve” understandable, discuss the results.
–>
exercises/2018_ethz_mmm/lennard_jones_cluster_2018.1519310029.txt.gz · Last modified: (external edit)

